Geography Notes Form 3
Geography Notes Form 3
Geography Notes Form 3
Statistics
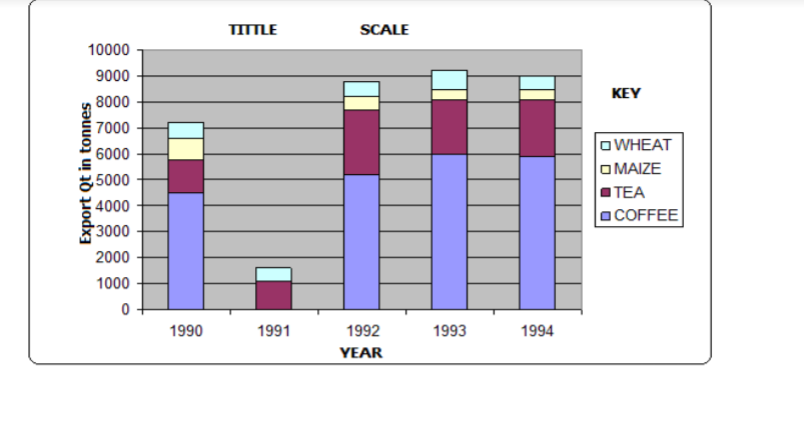
Compound/cumulative/divided
Bar Graph
Major Cash Crops Exported in Kenya in Tonnes
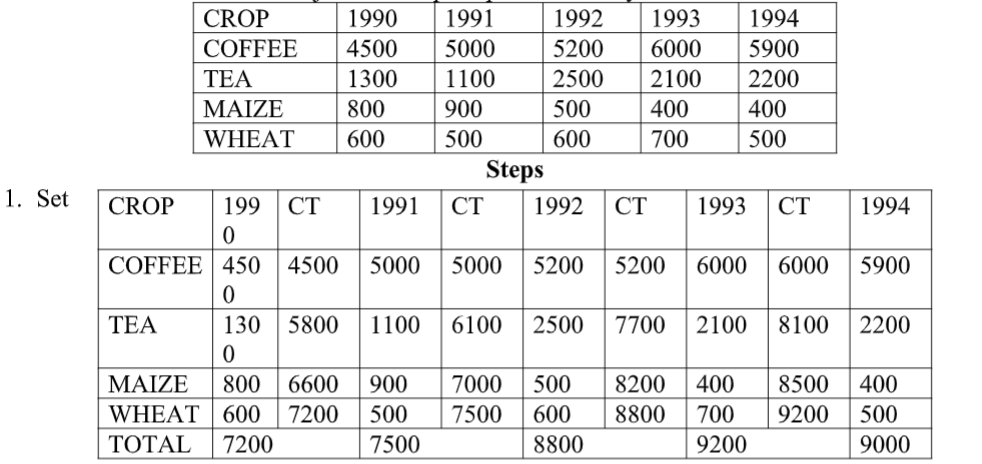
1. Set cumulative totals for the data each year
2. Draw vertical axis(Y) to represent dependent variable
3. Draw horizontal axis(x) to represent independent variable
4. Label both axis using suitable scale
5. Plot the cumulative values for each year
6. Use values for components to subdivide the cumulative bar
7. The subdivisions are placed in descending order with the longest at the bottom(coffee)
8. Shade each component differently
9. Put title and key
Advantages
1. Its easy to construct
2. It has good visual impression
3. There is easy comparison for the same component in different bars because of uniform shading
4. Easy to interpret because bars are shaded differently
5. Total value of the bar can be identified easily
Disadvantages
1. It doesn’t show the trend of components (change over time).
2. Cant be used to show many components as there is limited space upwards
3. Tedious as there is a lot of calculation work involved.
4. Not easy to trace individual contribution made by members of the same bar
5. Poor choice of vertical scale causes exaggeration of bars length leading to wrong conclusions
Analysis
– Coffee was the leading export earner in the five years.
– Tea was the second leading export earner.
– Wheat had the lowest export quantity.
– 1993 recorded the highest export quantity.
– 1990 recorded the lowest export quantity.
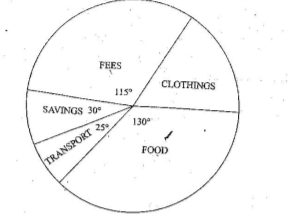
Piechart/dividedcircles/circle Charts
– A circle which has been subdivided into degrees used to represent statistical data where component values have been converted in degrees. Major countries producing commercial vehicles in the world in 000s

a) Convert components into degrees
USA 1800×360/5480=118.2◦
FRANCE 240×360/5480=15.8◦
JAPAN 2050×360/5480=134.7◦
UK 400×360/5480=26.3◦
GERMANY 240×360/5480=15.8◦
RUSSIA 750×360/5480=49.3◦
b) Draw a circle of convenient size using a pair of compasses.
c) From the centre of the circle mark out each calculated angle using a protractor.
d) Shade the sectors differently and provide the key for various shadings.
Advantages
1. Gives a good/clear visual impression
2. Easy to draw.
3. Can be used to present varying types of data e.g. minerals, population, etc.
4. Easy to read and interpret as segments are arranged in descending order and are also well shaded.
5. Easy to compare individual segments.
Disadvantages
1. Difficult to interpret if segments are many.
2. Tedious due to a lot of mathematical calculations and marking out of angles involved.
3. Can’t be used to show trend/change over a certain period.
4. Small quantities or decimals may not be easily represented.
Analysis
1. The main producer of commercial vehicles is Japan.
2. The second largest producer is USA followed by Russia.
3. The lowest producers were France and West Germany with.
Proportional Circles
This is use of circles of various sizes to represent different sets of statistical data. Table showing mineral production In Kenya from year1998-2000
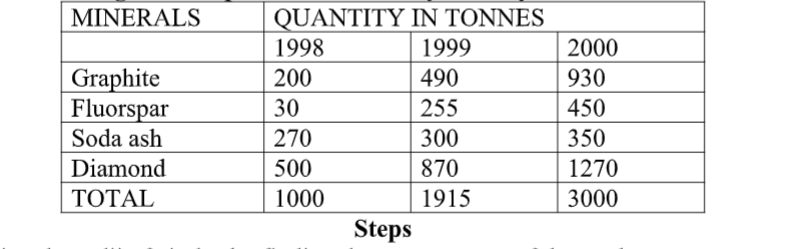
1. Determining the radii of circles by finding the square roots of the totals
1998 √1000=31.62=32
1999 √1915=43.76=44
2000 √3000=54.77=55
2. Scale:1cm represents 10 tonnes
1998=3.2 cm
1999=4.4 cm
2000=5.5 cm
3. Using a pair of compasses draw circles of different radii representing mineral production in Kenya between 1998 and 2000.
4. Convert component values into degrees
Component value/ total value of data×360
1998: Graphite-200/1000×360=72◦
Fluorspar-30/1000×360=10.8◦
Soda ash-270/1000×360=97.2◦
Diamond-500/1000×360=180◦
1999: Graphite-490/1915×360=92.1◦
Fluorspar-255/1915×360=47.9◦
`300/1915×360=56.4◦
Diamond-870/1915×360=163.6◦
2000: Graphite-930/3000×360=11.6◦
Fluorspar-450/3000×360=54◦
Soda ash-350/3000×360=42.1◦
Diamond-1270/3000×360=152.3◦
5. On the proportional circle for each year use a protractor and mark out the angles 6. Shade the segments and then provide a key.
Advantages
1. They give a good visual impression.
2. Easy to compare various components.
3. Simple to construct.
4. Easy to interpret as segments are arranged in descending order.
5. Can be used to present varying types of data.
Disadvantages
1. Tedious in calculation and measurement of angles
2. Actual values represented by each component cant be known at a glance
3. Difficult to accurately measure and draw sectors whose values are too small.
4. Comparison can be difficult if the circles represent values which are almost equal.
Analysis/Conclusions
1. Diamond was leading in production.
2. The second leading mineral in production was graphite.
3. The mineral with the lowest production was fluorspar.
Map Work Description of Relief
a) Describe the general appearance of the entire area e.g. hilly, mountainous, plain, undulating landscape, has many hills, isolated hills, etc.
b) State the highest and lowest parts of the area.
c) Look out for valleys which are occupied by rivers.
d) Divide into relief regions such as plateau, escarpment and lowland.
e) Explain the type of slop e.g. gentle, steep, even or irregular.
f) Direction of slope.
g) Identify the land forms present in the area.
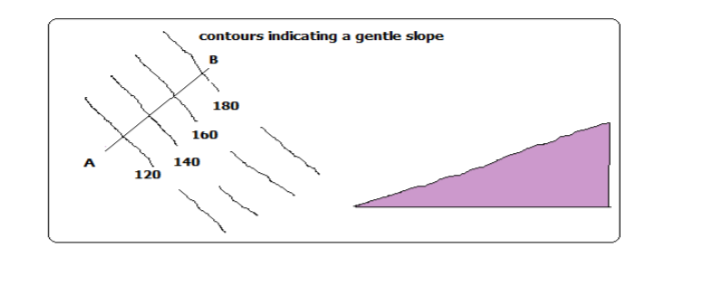
Gentle Slope
Slope is the gradient of land surface.
Gentle slope is one in which land doesn’t rise or fall steeply Contours are wide apart
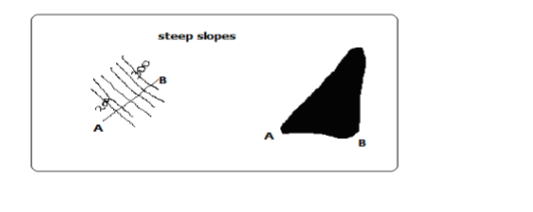
Steep Slopes
– Where land rises or falls sharply
– Contours are close to each other
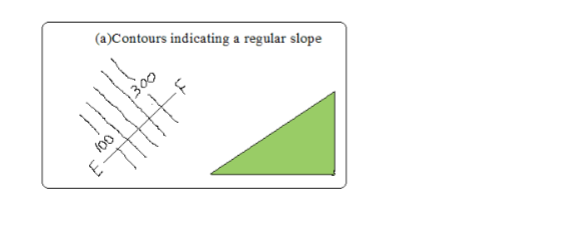
Even Slopes
– Shown by contours which are evenly spaced.
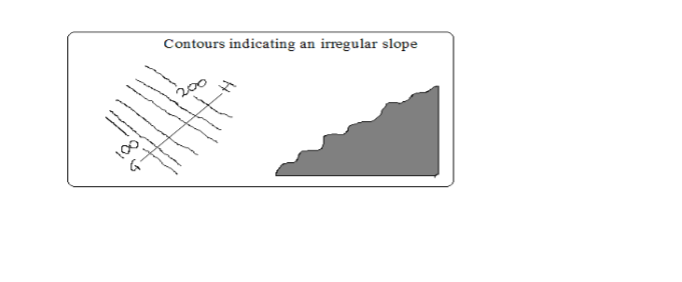
Uneven Slopes
– Indicated by unevenly spaced contours.
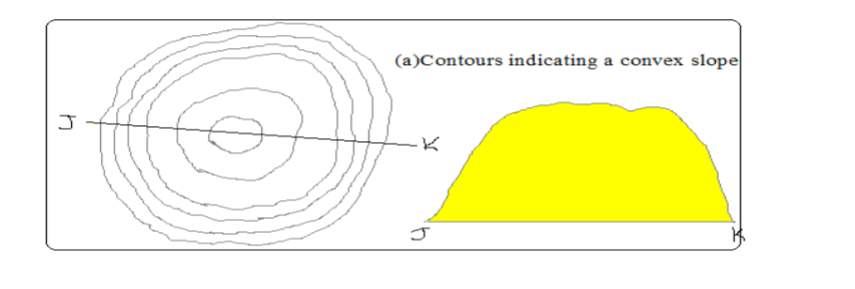
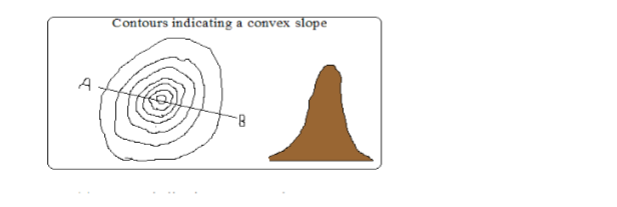
Convex Slopes
– One curved outwards
– Indicated by contours which are close together at the bottom and widely spaced together at the top.
Concave Slopes
– One curved inwards.
– Contours are close together at the top and widely spaced at the bottom.
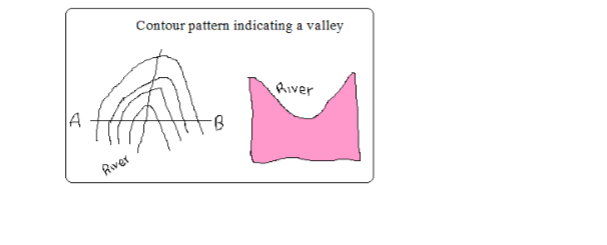
A Valley
– A low area between higher grounds.
– Indicated by U-shaped contours pointing towards a higher ground.
A Spur
– Land which is projected from high to low ground.
– Indicated by U-shaped contours bulging towards lower ground.

Interlocking Spurs
– Spurs which appear as if to fit together.
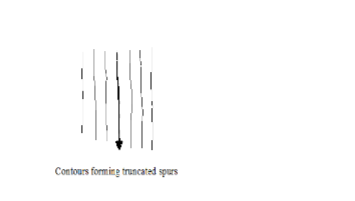
Truncated Spurs
– Spurs in glaciated highlands whose tips have been eroded and straightened.
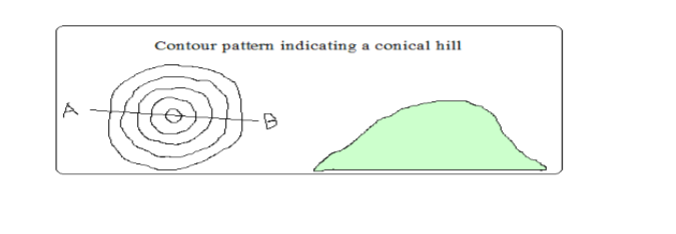
Conical Hills
– Hills are uplands which rise above relatively lower ground
– Conical hills are small rounded hills
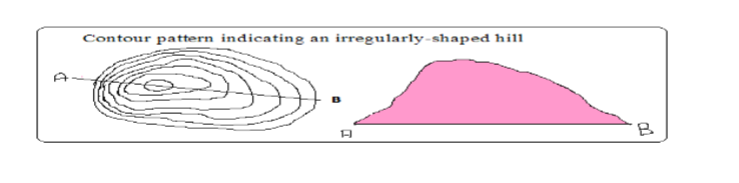
Irregular Shaped Hills
-A hill with some sides with uneven gentle and others with uneven steep slopes.
Ridges
– A range of hills with steep slopes on all sides.
– A ridge can contain hills, cols, passes or water shed.
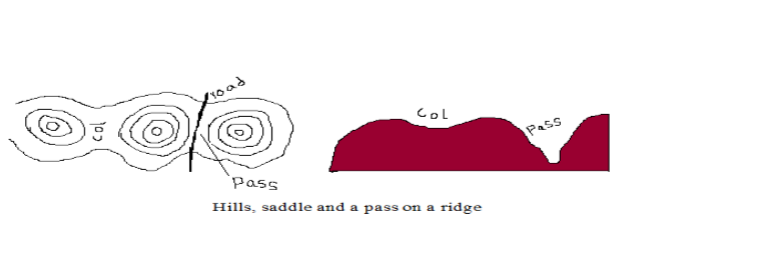
A Col
– A low area which occurs between two hills.
A Pass
– A narrow steep sided gap in a highland.
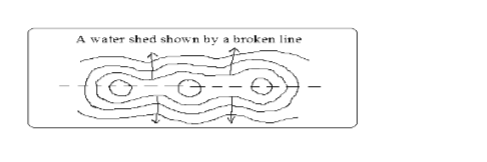
A Water Shed
– The boundary separating drainage systems which drains into different directions
– Escarpment and ridges often form water sheds.
Escarpment
– A relatively continuous line of steep slopes facing the same direction
– Has two slopes: a long gentle slope (dip slope) and short steep slope (scarp slope).

A Plateau
– A high flat land bound by steep slopes.

Description of Vegetation
Natural vegetation is classified as woodlands, thickets, scrubs or grasslands.
Symbols are given as pictures of vegetation.
• Types present
• Distribution
• Reasons for distribution e.g. seasonal streams, scrub or grassland due to low rainfall.
a) Forests
Likely indications of the following in the area:
• Heavy rainfall
• Fertile rainfall
• Cool temperature depending on altitude
b) Thickets and shrubs
• Seasonal rainfall
• Poor soil
• High temperature
c) Riverine trees
• High moisture content in the river valley
Describing Drainage
• Identify drainage features present
Natural drainage features include lakes, rivers, swamps, sea, rapids, water falls, cataracts, springs, deltas, fjords, sand or mud, and bays Artificial features include ponds, wells, boreholes, water holes, cattle dips, cattle troughs, canals, reservoirs, irrigation channels, aqueducts, water treatment plants and man made lakes.
• Identify main rivers by name
• Size of rivers-big or small-shown by thickness of blue lines.
• Give the general direction of flow.
• Location of water shed if any
• Characteristic of each feature
2024 FORM 1 2 3 4 REVISION RESOURCES
FORM 1 2 3 4 TERM 1 2 3 OPENER , MID AND END TERM EXAMS
1995-2024 KCSE KNEC PAPERS QUESTIONS,ANSWERS AND REPORT
2008-2024 KCSE FORM 4 COUNTY MOCKS
FORM 1 2 3 4 SCHEMES OF WORK
FORM 1 2 3 4 LESSON PLANS
FORM 1 2 3 4 CLASS REVISION NOTES
FORM 1 2 3 4 TERM 1 2 3 HOLIDAY ASSISNMENTS
FORM 3 4 SETBOOKS STUDY GUIDES
FORM 1 2 3 4 TOPICAL TESTS
FORM 1 2 3 4 REVISION BOOKLETS
LIFE SKILLS NOTES
FORM 1 2 3 4 SYLLABUS
KENYA SCHOOL CODES
HOW TO REVISE AND PASS EXAMS
GUIDANCE AND CONSELLING NOTES
CLICK HERE TO DOWNLOAD ALL LATEST 2024 KCSE REVISION MOCKS
KCSE COUNTY MOCKS DOWNLOADS 2024
2023 KCSE COUNTY MOCKS DOWNLOADS
- 2023 KAPSABET BOYS POST MOCK
- PANGANI MOCK KCSE 2023
- KCSE 2023 LAINAKU II FORM 4 JOINT MOCK
- KENYA HIGH POST MOCK
- KALA MOCK =Password is- subjectcodeKALA2023
- KCSE 2023 SAMIA JOINT MOCK
LANJET 2023 EVALUATION MOCK
2023 EVALUATION MOCK nyandarua trial 4
2023 EVALUATION MOCK nyandarua trial 3
KCSE 2023 MOCKS NYARIRA CLUSTER EXAMS
KCSE 2023 CEKANA MOCKS
KCSE 2023 ACHIEVERS JOINT MOCK
- KAPSABET 2 MOCK 2023
- MOKASA 2 MOCK 2023
- 2023 Mang’u high revision mock
- FORM 4 TERM 2 BAKALE EXAM
CATHOLIC DIOCESE OF KAKAMEGA MOCK
- BSJE JOINT MOCK EXAM 2023
- MARANDA HIGH SCHOOL MOCK JUNE
- KCSE 2023 mock Nginda girls
- 2023 Kcse mock Wahundura
- 2023 Kcse mock set 22
KCSE 2023 KASSU MOCK EXAMS
- 2023 KCSE EAGLE TRIAL 1 MOCK
- 2023 lainaku revision mock
- 2023 FORM 4 evaluation exams set 18
- 2023 FORM 4 evaluation exams set 17
- 2023 FORM 4 evaluation exams set 16
LUGARI CONSTITUENCY -MOCK 1
- 2023 KCSE FORM 4 EVALUATION TEST
2023 mokasa mocks revision exams
- SUKELLEMO JOINT PRE-MOCK EXAMS
- Mumias west pre mock kcse exams
- 2023 SUNRISE PRE-MOCK
- 2023 kcse arise and shine pre-mock
- MECS CLUSTER JOINT MOCK EXAM
- Chogoria murugi zone pre-mock
- MOMALICHE 2 EXAMS PRE MOCK
- ASUMBI PRE MOCK EXAMS 2023
- 2023 MARANDA HIGH PRE-MOCK
- KAPSABET INTERNAL TRIAL 1 2023
- FORM 4 EVALUATION TEST 2023
- 2023 FORM 4 evaluation exams
Mock exams and pre-mock exams are practice tests that are taken before the actual exams.
2022 COUNTY MOCKS 38 EXAMS
2021-22 COUNTY MOCKS 36 EXAMS
2020-21 COUNTY MOCKS 24 EXAMS
2019 COUNTY MOCKS 44 EXAMS
2018 COUNTY MOCKS 23 COUNTIES EXAMS
2017 COUNTY MOCKS 25 COUNTIES EXAMS
2016 COUNTY MOCKS 16 COUNTIES
2015 COUNTY MOCKS 20 COUNTIES
2008 , 2009 , 2010 , 2011 , 2012 , 2013, 2014 COUNTY MOCKS 25 COUNTIES
2023 KCSE COUNTY MOCKS Mock exams and pre-mock exams are practice tests that are taken before the actual exams.
They are designed to help students get a sense of what to expect in the real exam and to identify areas where they need to improve.
The purpose of taking mock exams is to help students build confidence, develop test-taking strategies, and identify their strengths and weaknesses.
Pre-mock exams are usually taken a few weeks or months before the actual exam, while mock exams are usually taken closer to the exam date.